Data-Science (Part 6)-Discretization, Continuation, Normalization, Randomization on the data
- Thakkar Vedang

- Oct 30, 2021
- 2 min read
This blog is about using the Orange tool to preprocess data. Previous blogs can be found here. In this blog, I’ll show you how to utilize the Orange library in Python to accomplish data pre-processing tasks such as Discretization, Randomization, and Normalization using various Orange functions.
In this demonstration, we’ll use the Orange tool.

Discretization
Data discretization is a technique for transforming a large number of data values into smaller ones, making data interpretation and management easier.
To put it another way, data discretization is a technique for turning continuous data’s attribute values into a finite collection of intervals with little data loss.
I’ve used the built-in dataset provided by Orange, iris, to classify flowers based on their features in this example. The Discretize function is used to execute discretization.
import Orange
iris = Orange.data.Table(“iris.tab”)
disc = Orange.preprocess.Discretize()
disc.method = Orange.preprocess.discretize.EqualFreq(n=3)
d_iris = disc(iris)
print(“Original dataset:”)
for e in iris[:3]:
    print(e)
print(“Discretized dataset:”)
for e in d_iris[:3]:
    print(e)
Continuization
Return a new table with the discretize attributes changed with continuous or removed from a data table.
Depending on the input zero based, binary variables are translated into 0.0/1.0 or -1.0/1.0 indicator variables.
The input multinomial treatment determines how multinomial variables are treated.
Discrete properties that can only have one value are eliminated.
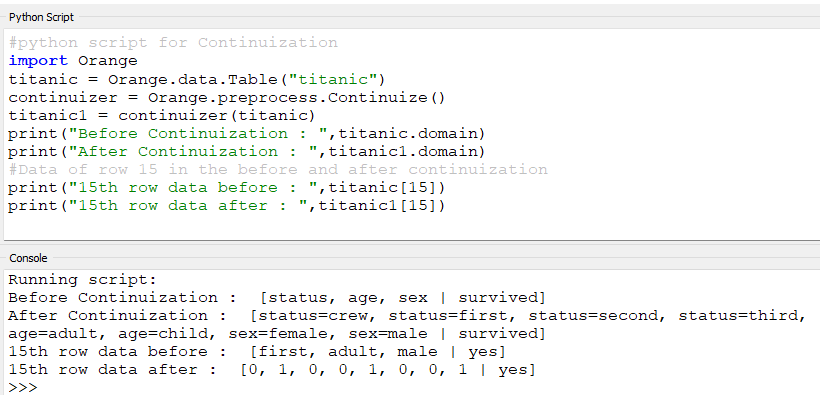
Continuation Indicators
Indicator variables are used to replace the variable, each of which corresponds to one of the original variable’s values.
Only the relevant new attribute will have a value of one for each value of the original attribute, while the others will be zero.
This is how things work by default.
#python script for Continuization
import Orangetitanic = Orange.data.Table("titanic")
continuizer = Orange.preprocess.Continuize()
titanic1 = continuizer(titanic)
print("Before Continuization : ",titanic.domain)
print("After Continuization : ",titanic1.domain)
print("15th row data before : ",titanic[15])
print("15th row data after : ",titanic1[15])
Normalization
Normalization is a technique for reducing the range of an attribute’s data, such as -1.0 to 1.0 or 0.0 to 1.0.
When dealing with attributes on multiple scales, normalization is usually essential; otherwise, the effectiveness of an important, equally important attribute (on a smaller scale) may be diluted due to the presence of other qualities with values on a bigger scale.
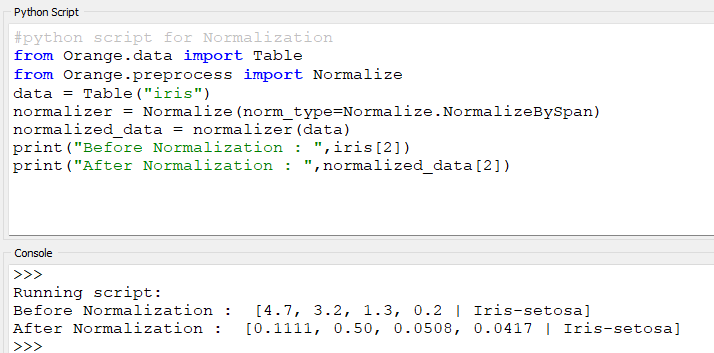
To perform normalization, we use the Normalize function.
#python script for Normalization
from Orange.data import Table
from Orange.preprocess
import Normalizedata = Table(“iris”)
normalizer = Normalize(norm_type=Normalize.NormalizeBySpan)
normalized_data = normalizer(data)
print(“Before Normalization : “,iris[2])
print(“After Normalization : “,normalized_data[2])

Randomization
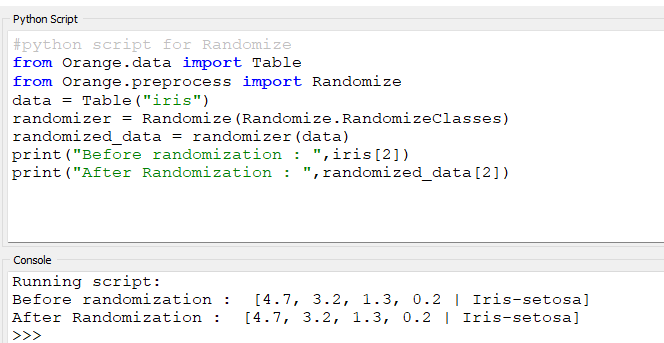
Given a data table, the randomization preprocessor returns a new table with the contents jumbled.
To accomplish randomization, the Orange library’s Randomize function is used.
#python script for Randomize
from Orange.data
import Tablefrom Orange.preprocess
import Randomizedata = Table(“iris”)
randomizer = Randomize(Randomize.RandomizeClasses)
randomized_data = randomizer(data)
print(“Before randomization : “,iris[2])
print(“After Randomization : “,randomized_data[2])
So, we’ve seen how to use the Orange tool to sample data and compare different learning algorithms to determine which is the best method for our data set.


Comments